
3rd January 2022, Dr Chee L Khoo

Diabetes is associated with a whole myriad of complications. Traditionally, complications were categorised into macrovascular and microvascular complications. We have added heart failure and arrhythmias to that list. We have made much headway and have seen declines in non-fatal incidence of these traditional diabetes complications, in parallel with declines in all-cause mortality in people diagnosed with diabetes. There are now emerging non-traditional complications which is increasing the share of the morbidity and mortality burdens in people with diabetes. So, what has improved and what has not? What is “new” to the scene? It is important for us to be familiar with and be looking out for these new complications so that we can reduce or prevent them.
Pearson-Stuttard et al recently published their data on a comparison of cause specific hospitalisations in individuals with diabetes in 2003 and in 2018 (1). Using data from the Clinical Practice Research Datalink (CPRD) which is linked to Hospital Episode Statistics (HES), 309 874 adults were identified as diagnosed with diabetes in England, UK, from Jan 1, 2003, to Oct 30, 2018. They matched diabetes participants to people without diabetes by decade of birth, resulting in 309 874 (100%) matched individuals without diabetes.
They then examined the spectrum of causes of hospitalisations. They created several categories of morbidity:
- traditional diabetes-specific complications including acute metabolic decompensations, cardiovascular diseases, microvascular disease
- non-specific diabetes complications (i.e. conditions with increased risk for those with diabetes, including liver disease, site-specific cancers [namely colorectal, pancreatic, liver, breast, endometrial, and gallbladder], and common infections); and
- other associated conditions which previous analyses have shown to have a high attributable portion of mortality burden in the diabetes population (eg, respiratory disease, all other cancers)
Excess hospitalisation rates were calculated as the absolute difference in adjusted rates in a given year between the diabetes and non-diabetes populations.
Results
As expected, hospitalisation rates for all causes studied were higher in people with diabetes than in those without diabetes at the beginning and end of the study period. Hospitalisation rates due to vascular disease, diabetes, and amputations declined between 2003 and 2018, and hospitalisation rates due to cancers not related to diabetes, respiratory infections, renal infections, sepsis, and renal, respiratory, and liver disease increased between 2003 and 2018.
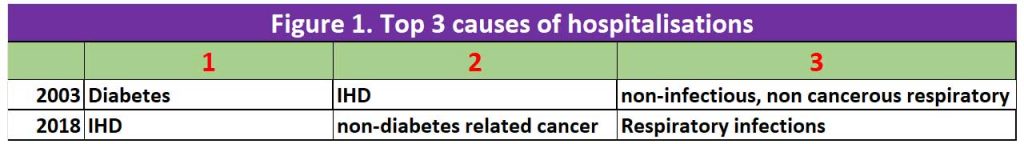
In 2003, in men with diabetes, hospitalisation for diabetes itself was the leading cause of excess hospitalisation (an excess of 158·0 hospitalisations per 10 000 men) followed by ischaemic heart disease (138·9 excess hospitalisations per 10 000 men) and non-infectious, non-cancerous respiratory conditions (49·5 excess hospitalisations per 10 000 men).
In 2018, ischaemic heart disease was the leading cause of excess hospitalisation (98·7 excess hospitalisations per 10 000 men) followed by non-diabetes-related cancers (89·7 excess hospitalisations per 10 000 men) and respiratory infections (75·8 excess hospitalisations per 10 000 men). See figure 1.
In 2003, in women, diabetes (159·4 excess hospitalisations per 10 000 women) and ischaemic heart disease (87·9 excess hospitalisations per 10 000 women) were also the leading causes of excess hospitalisation, followed by kidney infections (64·7 excess hospitalisations per 10 000 women).
In 2018, these previously leading causes of excess hospitalisations in women were no longer in the top three causes of excess hospitalisation, having been replaced by non-infectious and non-cancerous respiratory conditions (93·5 excess hospitalisations per 10 000 women), respiratory infections (76·3 excess hospitalisations per 10 000 women), and non-diabetes-related cancers (63·6 excess hospitalisations per 10 000 women.
What declined?
The largest declines in the rates of hospitalisations between 2003 and 2018 were seen in ischaemic heart disease, which declined by 29·0% in men (from 278·4 hospitalisations to 197·8 hospitalisations per 10 000 men) and 34·2% in women (from 179·8 hospitalisations to 118·3 hospitalisations per 10 000 women.
What went up?
The largest observed increases in hospitalisations between 2003 and 2018 were due to non-diabetes-related cancers (an increase of 40·4% [238·9 hospitalisations to 335·4 hospitalisations per 10 000 men] and 44·2% [159·3 hospitalisations to 229·7 hospitalisations per 10 000 women]) and respiratory infections (an increase of 166·9% [64·6 hospitalisations to 172·4 hospitalisations per 10 000 men] and 192·9% [59·4 hospitalisations to 174·0 hospitalisations per 10 000 women])
The three traditional diabetes-specific complication groupings of vascular, diabetes, and amputations collectively accounted for around 60% of the hospitalisation burden of all of the causes in 2003 (58% in men and 49% in women), declining to close to one-third in 2018 (38% in men and 28% in women). The approximate halving in hospitalisations due to skin and bone infections might be due to the increased access to multidisciplinary footcare teams for those with diabetic foot disease over this period.
Conversely, the proportion of hospitalisations due to cancer increased from 17% in 2003 to 21% in 2018 in men and from 16% in 2003 to 20% in 2018 in women, with much larger increases in hospitalisations due to non-diabetes-related cancers than diabetes-related cancers.
The largest increase in the proportion of hospitalisations that a cause is attributal for was seen in the infections grouping, in which hospitalisations due to respiratory infections increased from 4·3% to 10·6% in men and from 4·6% to 12·4% in women. Hospitalisations due to sepsis increased from 1% to 6% in both men and women.
The findings of this study mirror the findings in US patients with diabetes where acute myocardial infarction decreased by 68%, stroke by 53%, and amputations by 52% from 1990 to 2010,5 although declines appear to have plateaued in younger adults since 2010 (2). Similarly, in this study, the pace of decline in hospitalisations due to ischaemic heart disease, diabetes, acute myocardial infarction, stroke, and major amputations diminished in the latter years.
Overall, the case mix of hospitalisation have changed as we are better in managing the macro and microvascular complications of diabetes. We now have more infections (including respiratory) and cancers affecting our patients with diabetes. Major amputations in the UK cohort may be coming down but I am not sure that we are on same page as our UK counterparts. There’s more work to do in primary care if we are to reduce overall morbidity and mortality.
References:
- Pearson-Stuttard J, Cheng YJ, Bennett J, Vamos EP, Zhou B, Valabhji J, Cross AJ, Ezzati M, Gregg EW. Trends in leading causes of hospitalisation of adults with diabetes in England from 2003 to 2018: an epidemiological analysis of linked primary care records. Lancet Diabetes Endocrinol. 2022 Jan;10(1):46-57. doi: 10.1016/S2213-8587(21)00288-6. Epub 2021 Nov 30.
- Gregg EW, Hora I, Benoit SR. Resurgence in diabetes-related complications. JAMA 2019; 321: 1867–68.