
The Diabetes Control and Complications Trial (DCCT) demonstrated that intensive glucose lowering in patients with type 1 diabetes (T1D) reduce the risk of long term diabetes complications (1). Similar results were demonstrated in patients with type 2 diabetes (T2D) in the UK Prospective Diabetes Study (UKPDS). But intensive glucose control involves finger pricks at least 4-8 times a day and is not sustainable in the medium to long term in most patients. The adoption of continuous glucose monitoring (CGM) is rapidly accelerating in primary care amongst patients with type 2 diabetes on insulin therapy. We have evidence linking traditional glucose measurements and HbA1c with clinical outcomes and diabetic complications but do we have evidence linking CGM with similar outcomes? How does the CGM data relate to the traditional glucose metrics?
Because CGM generates such a wealth of data, it requires various tools to analyse and help us interpret them. The data analysis tools offer patients and healthcare professionals a wide range of metrics of glucose control quality, including number of days worn, percentage of time CGM is active, mean glucose, estimated HbA1c (now called glucose management indicator), glycaemic variability (%CV) and TIR (time in range) (3)
With devices where the user gets to see their readings “live”, the presentation of the data needs to be both user friendly and meaningful to the patient and healthcare professional. Thus, among these metrics, TIR has surfaced as a measure that is preferred by patients because of its bearing on daily life. TIR has been identified by individuals with diabetes as impacting the quality of daily life and it may therefore correlate better with the patient experience and patient-reported outcomes. Further, TIR may be useful at times when there is discordance between HbA1c levels and mean glucose (e.g. chronic kidney disease or haemoglobinopathy).
Time in range, Time above range, Time below range
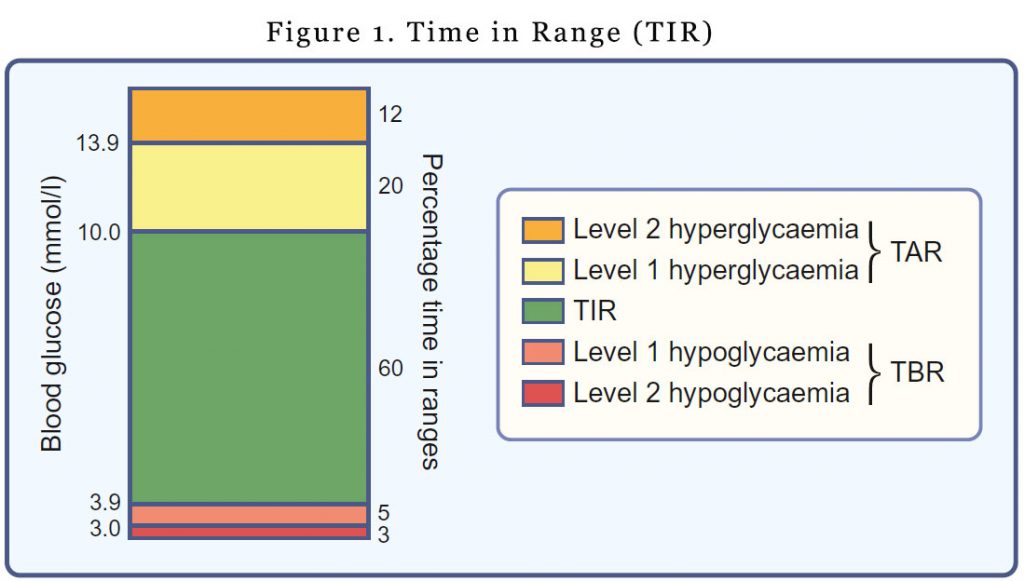
TIR refers to the amount of time glucose levels fall within a target range (typically between 3.9 mmol/l and 10.0 mmol/l). You would have noticed that the upper and lower limits for determining TIR are not synonymous with the upper and lower limits of ‘normal’ glucose values. The upper limit for determining TIR has been set at 10.0 mmol/l to align with the recommended target upper limit for peak postprandial glucose levels for people with diabetes. It’s a pragmatic definition. Outside of the pregnancy setting, most individuals with type 1 diabetes are unable to spend most of the day with glucose levels in the 3.9–7.8 mmol/l range.
For time above range (TAR), hyperglycaemia is subdivided into level 1 (glucose 10.1–13.9 mmol/l) and level 2 (glucose >13.9 mmol/l).
Time below range (TBR) is also subdivided into level 1 (glucose 3.0–3.8 mmol/l) and level 2 (glucose <3.0 mmol/l). The lower limit for determining TIR (glucose 3.9 mmol/l) reflects the upper limit of the efinition of hypoglycaemia, the point at which counter-regulatory hormone release generally begins to occur.
Different glucose thresholds for determining TIR are applied in pregnancy (3.5–7.8 mmol/l), with an upper limit of 7.8 mmol/l aligning with the 1 h post-meal glycaemic threshold target for pregnancy (4) and a lower limit of 3.5 mmol/l based on levels safely achieved in recent clinical trials (5,6).
TIR and long term diabetes complications
During the course of the DCCT, participants conducted seven-point profile testing of blood glucose concentrations for 1 day every 3 months. Although not quite TIR from a CGM device, investigators derived TIR from the seven-point profiles and concluded that for every 10% lowering of TIR, the adjusted hazard rate for the retinopathy outcome in the DCCT was increased by 64% and the adjusted hazard rate for the microalbuminuria outcome was increased by 40% (7)
Evidence is beginning to emerge indicating that TIR from CGM can predict the risk of long-term diabetes complications (7) and pregnancy outcomes (5,6). Time in range assessed by CGM in 3,262 patients with type 2 diabetes were correlated with the prevalence of diabetic retinopathy (DR) in a Chinese study. The prevalence of DR decreased with increasing TIR. Patients with more advanced DR had lower TIR.
This is no rocket science as the lower the TIR, the higher the likelihood that there is more opportunity for glucose to be above 10 mmol/L (after adjusting for TBR).
TIR targets
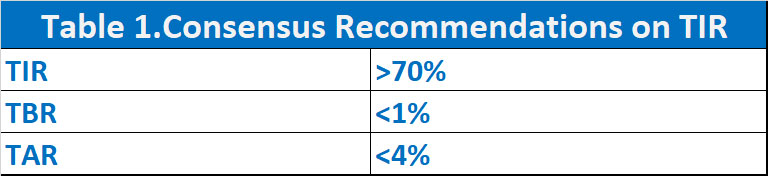
The available evidence we have thus far, has allowed recommendations from international consensus on TIR, TBR and TAR. There is insufficient evidence to justify separate targets for T1D and T2D. For most patients, it is recommended that we keep the TIR >70%, TBR <1% and TAR <4%. Of course, all targets need to be individualised. For older patients or patients at risk of hypoglycaemia, a lower TIR may be acceptable with more emphasis on even lower TBR.
TIR and mean glucose were highly correlated, a wide range of HbA1c values were associated with any particular TIR (8) There is quite a degree of variability in the reported relationship between TIR and HbA1c according to different studies. Nonetheless, adults a TIR of 65–70%, derived by CGM, appears to equate with mean glucose levels broadly similar to those reflected by an HbA1c of 7.0% (53 mmol/mol).
The Future
TIR is not quite a replacement for HbA1c yet but it provides complementary information as to the quality of glycaemic control in our patients with diabetes. TIR provide both an educational as well as a motivational tool in our discussions with patients with diabetes.
Cost remains a major barrier in the uptake of these devices. Advances in technology will see the size of the sensors decreasing, removing aesthetics as barrier. Implantable devices are on the horizon. As GPs, while we need to keep abreast with developments in diabetes management, we also need to keep abreast with technology relating to diabetes management.
References
- The Diabetes Control and Complications Trial Research Group (1993) The effect of intensive treatment of diabetes on the development and progression of long-term complications in insulin dependent diabetes mellitus. N Engl J Med 329(14):977–986.
- UK Prospective Diabetes Study (UKPDS) Group. Intensive compared with conventional treatment and risk of complications in patients with type 2 diabetes (UKPDS 33). Lancet 1998; 352: 837–853
- Battelino T, Danne T, Bergenstal RM et al (2019) Clinical targets for continuous glucose monitoring data interpretation: recommendations from the international consensus on time in range. Diabetes Care 42(8):1593–1603.
- American Diabetes Association (2019) 14. Management of diabetes in pregnancy: standards of medical care in diabetes-2019. Diabetes Care 42(Suppl 1):S165–S172.
- Feig DS, Donovan LE, Corcoy R et al (2017) Continuous glucose monitoring in pregnant women with type 1 diabetes (CONCEPTT): a multicentre international randomised controlled trial. Lancet 390(10110):2347–2359.
- Kristensen K, Ogge LE, SengpielVet al (2019) Continuous glucose monitoring in pregnant women with type 1 diabetes: an observational cohort study of 186 pregnancies. Diabetologia 62(7):1143–1153.
- Beck RW, BergenstalRM, Riddlesworth TD et al (2018) Validation of time in range as an outcome measure for diabetes clinical trials. Diabetes Care 42(3):400–405.
- Beck RW, Bergenstal RM, Cheng P et al (2019) The relationships between time in range, hyperglycemia metrics, and HbA1c. J Diabetes Sci Technol 13(4):614–626.